
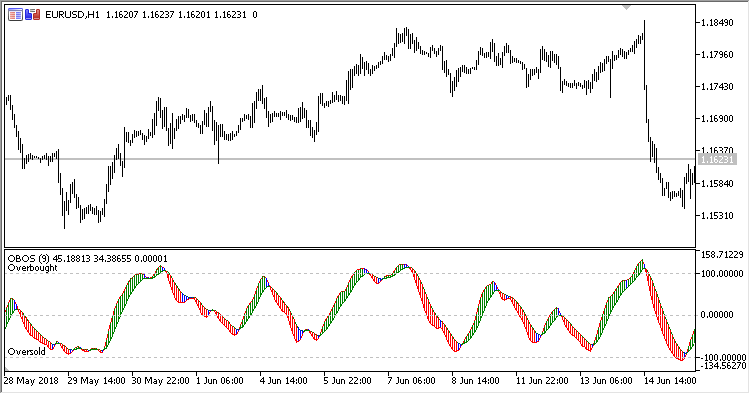
Overbought/Oversold oscillator displays the market movement direction color histogram in a separate window.
The indicator has three input parameters:
- Period - calculation period
- Overbought - overbought level
- Oversold - oversold level
Calculation:
Up = EMA(EMA((WP-EMA(WP)) / StdDev(WP)))
Down = EMA(Up, Period)
where:
EMA - EMA(PRICE_WEIGHTED, Period)
StdDev - StdDev(PRICE_WEIGHTED, Period)
WP - weighted price (High+Low+Close+Close)/4
The upward movement is displayed by the green histogram
The downward movement is displayed by the red histogram
Uncertain movement is displayed by the gray histogram

No comments:
Post a Comment