Showing posts with label Forex Strategies. Show all posts

Saturday 5 December 2020

Forex Pet-D scalping system


Pet-D scalping system
is a trend momentum strategy based on Pet-D indicator. This is a intraday system thaty work also with binary options High/Low.

Time Frame 15 min or higher.

Markets: Indicies (S&P 500, Dax, Dow Jones, FTSE, Nasdaq), Commodites (Gold, Silver and oil) and Forex Majors.

For Binary Options trading expiry time 3 candles max 4.

Metyatrader Indicators:

Spud Fibo or an indicators of pivot level.

RSI (14 period with level 55 and 45),

DoubleCCI ( 170 and 34),

PET-D .

Buy

Pet-D green bar,

Double CCI histogram green,

RSI>55 level.

Sell

Pet-D red bar,

Double CCI histogram red,

RSI<45 level.

Exit position

At the level of support/resistance or with profit target ( 9-14 pips).

Initial Stop loss at the previous swing after 8 pips in gain move stop loss at -2 pips or breakeven level.


Tags:


fx sniper 24 system


pet-d indicator formula


free scalping indicator


scalping solution indicator free download


best scalping indicator mt4


free forex systems and indicators


binary sniper indicator free download


sniper system forex

Tuesday 1 December 2020

Find The Best Pairs For Your Strategy With This Indicator

 I am back with another brand-new indicator the OGT RSI SENSITIVITY v1.0.


This indicator will give you a TRADING EDGE as it shows if a currency pair has mean reverting or momentum properties.

Any trading strategy is ultimately a mean reverting or momentum trend trading strategy. Would you like to know WHICH PAIRS and TIME FRAME best suits your strategy?

The OGT RSI Sensitivity Indicator scans all RSI overbought/oversold signals of a currency pair and calculates whether the outcome of each signal mean reverted or continued momentum.

We know that the movement and volatility of a pair changes over time, with short and long term scan periods to choose from, you can tell a currency pairs property in CURRENT MARKET CONDITIONS.

Inserted Video


The indicator is completely customisable with your own RSI period, OB/OS levels and the number proceeding bars to check if price mean reverting or continued momentum.

The output is a text file which provides the data for all time frames and overall for the pair. The data is extremely useful in identify which pair and the time frame to focus on.

Attached Image (click to enlarge)
Click to Enlarge  Name: 887f639efec2d797f14696c8f3f19f9d.png Size: 60 KB

All the details of how to use the indicator is in the video above. As always love to hear your feedback.


Monday 30 November 2020

simplest pips winning strategy best for mt4

 When price is above an open, it is up. Conversely, when price is below an open, it is down. It is a good idea not to short when price is up and not to buy when price is down. Naturally, most traders look for reversals but are impatient and trigger happy thus buying when they should be selling and vice-versa.


A sell below the H1 open of the bar immediately following the bar making the highest high would have resulted in profit. In summary, a bar makes a high and closes. Next bar fails to make a higher high and reverses. Sell when price drops below the open price of the current bar.

A buy above the H1 open of the bar immediately following the bar making the lowest low would have resulted in profit. In summary, a bar makes a low and closes. Next bar fails to make a lower low and reverses. Buy when price rises above the open price of the current bar.

Please understand none of this is original or new and this is presented for EDUCATIONAL PURPOSES ONLY. You may find your results may differ. Please check with an accredited financial specialist before using real money. FOREX trading can be risky. YOU HAVE BEEN WARNED! 


"Perfection is not when you have nothing more to add, but when you have nothing more to take away." - Antoine De Saint Exupery

"It is not about adding on, but taking away. The less technique, the better you are." - Bruce Lee


Someone pointed out RULE #3 could be interpreted in more than one way.
See modification on chart.
You want to trade AWAY from the daily high after price makes a new daily high and
trade AWAY from the daily low after price makes a new daily low.
You are ALWAYS trading towards the daily open with this method.

Indicators and templates are in the attachments.


Monday 23 November 2020

Payapa Forex Trading Strategy - Daytrading strategies


The Payapa Forex Trading Strategy uses RSI and 5 EMAs with different settings.

We use levels at the RSI to find out overbought and oversold.
We predict the direction of prices with 5 EMAs.
We do BUY when all EMAs are at level 10 of RSI, and turn up.
We do SELL when all EMAs are at level 90 from RSI, and turn down.
Be careful when the 200 EMA is at level 50, because prices can bounce up or down.

RSI Settings:
RSI Period = 1
Color = Black
Level = 10, 30, 40, 50, 60, 70, 90.

MA Settings:
1. EMA 5 = Red
2. EMA 8 = Yellow
3. EMA 13 = Green
4. EMA 21 = Blue
5. EMA 200 = Purple.

Practice on a demo account first before using a real account.


Trending Price Action Forex Strategy


Trending Price Action Forex Strategy

“Trade with the trend!”

Trading against the trend is very difficult. It is like swimming on a river going upstream. Trading against the trend means you are trading against the momentum of the market. This stacks all the odds against you. Imagine, you are trading against the whole market. It is like you against the trading world.

So, many traders decide to try trading with the trend. But, many new traders who decided to be a trend following trader don’t even know how to properly identify a trend. How could we trade with the trend if we don’t know how to identify the trend?

There are many ways to identify a trend. One could use a moving average, or a band of moving averages. Others use indicators. Others intuitively look at a naked chart.

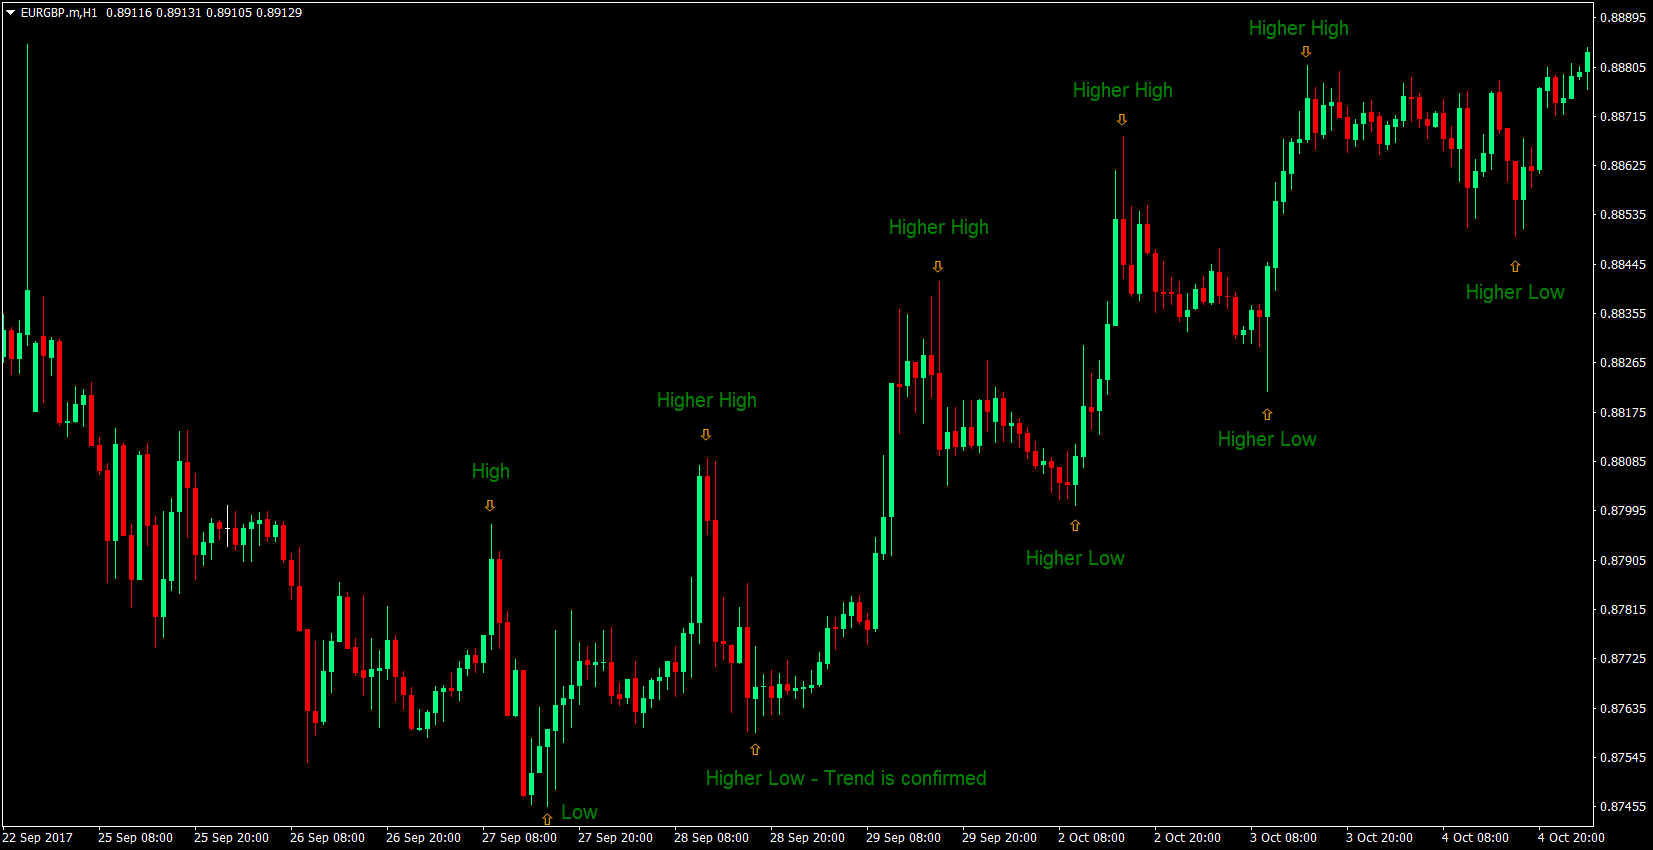
Price action traders typically look at a naked chart to identify a trend. They define an uptrend as one that prints a higher high compared to the previous high, and confirmed by a higher low compared to the previous low. For a downtrend, they define it as one that prints a lower low compared to the previous low and confirmed by a lower high compared to the previous high.

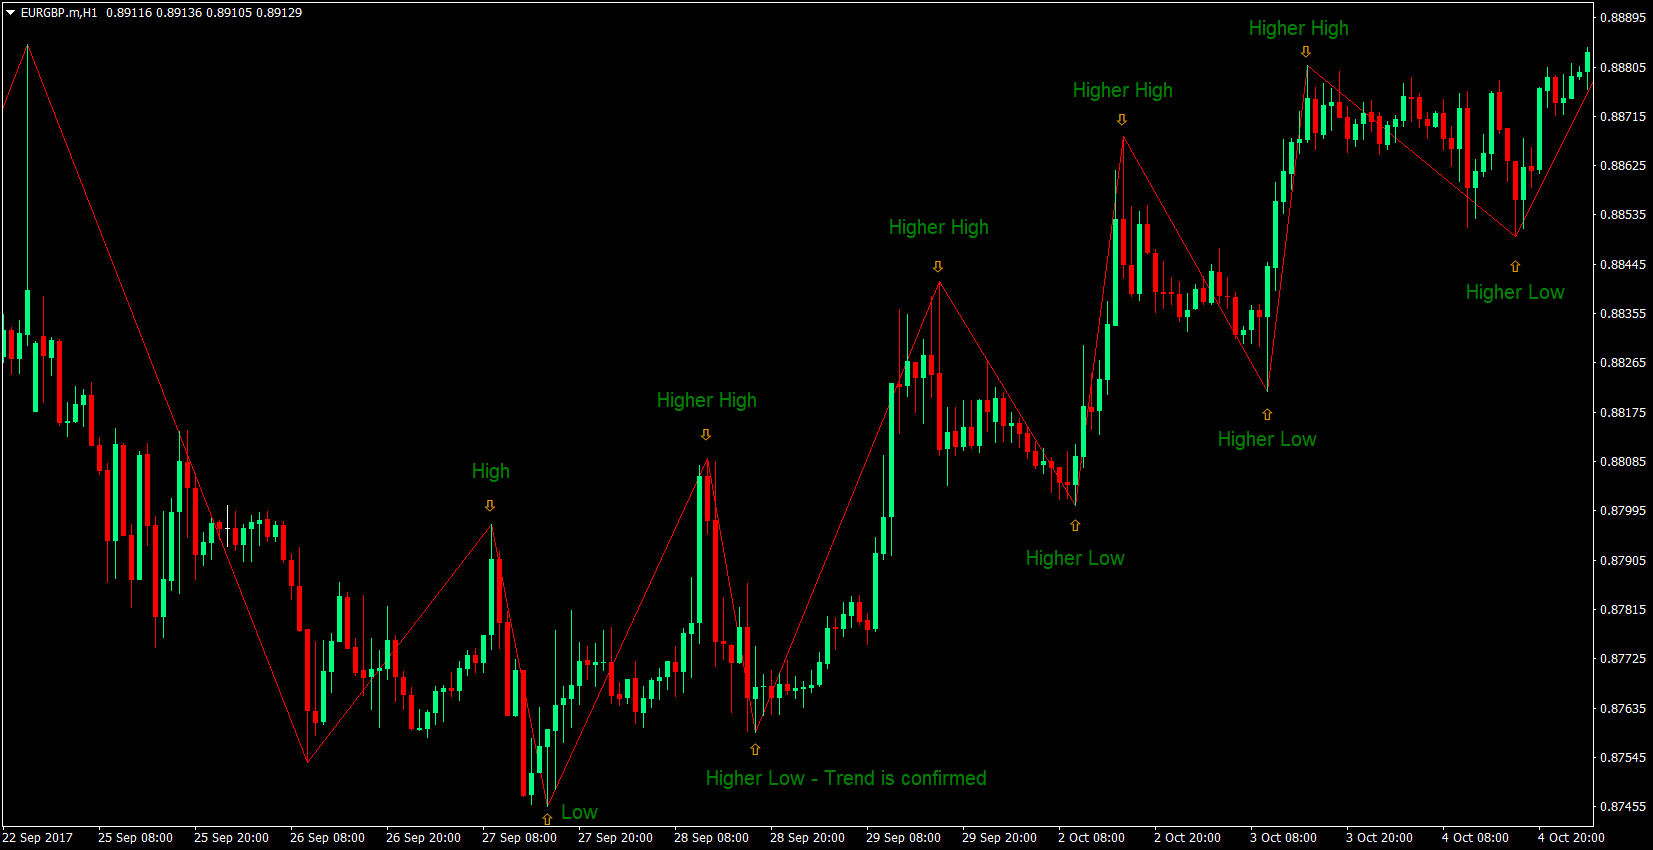
The ZigZag Indicator

Newbies in price action trading though, find it hard to assess a swing high and low. On a naked chart, without any indication pointing a swing high or swing low, this may seem confusing and cause lack of confidence on a trading setup. What we could do however, is use the ZigZag indicator to help us identify the swing highs and swing lows. This makes things much easier.

Marking Support Areas

One concept in trading is that an area of resistance, once broken, becomes an area of support. In a trending market, possible horizontal areas of resistance are constantly broken. This creates for us, areas of support, which we could trade on.

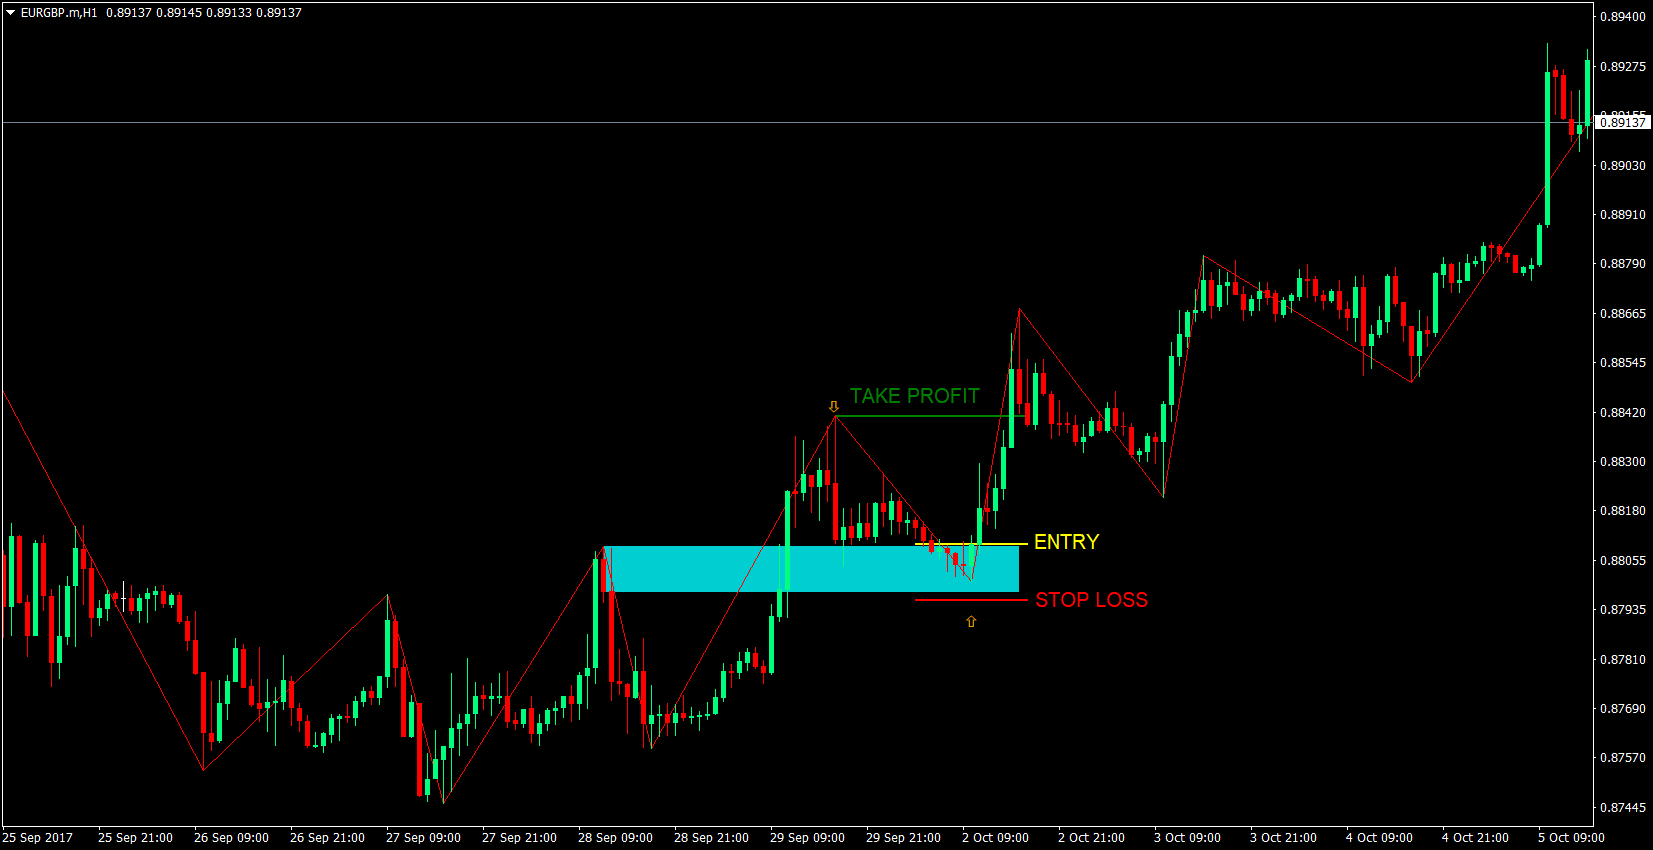
To trade this system, we will be marking the broken highs as areas of support. To mark these areas of support, on an uptrend, we will be marking from the upper wick of a swing high up to its whole body.

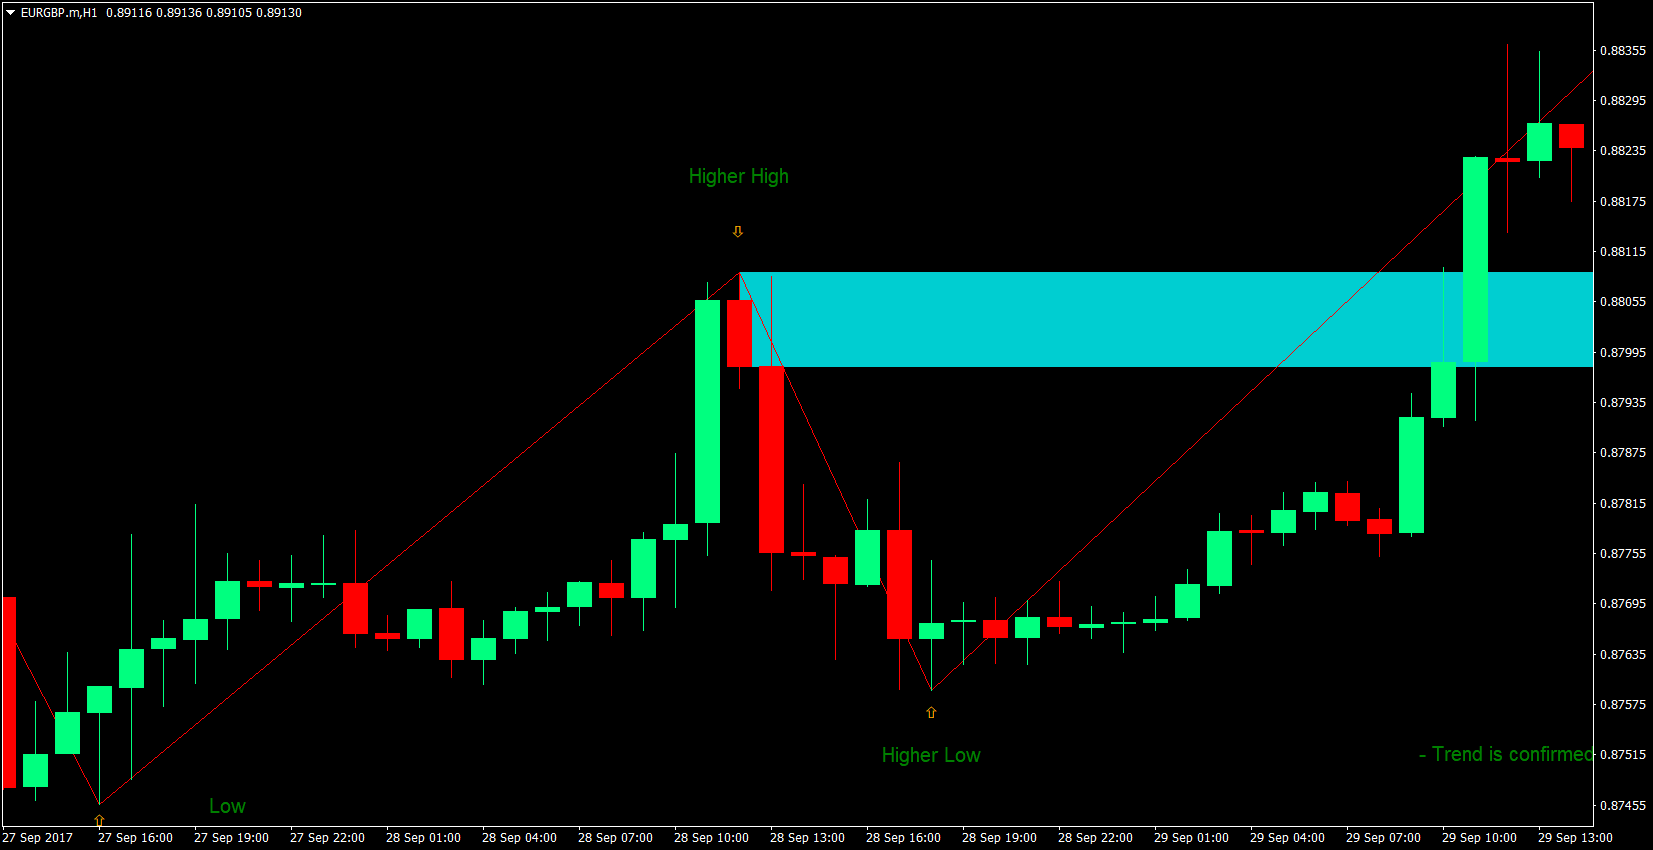
On the chart below, notice how price respects these areas of support during this bullish market.

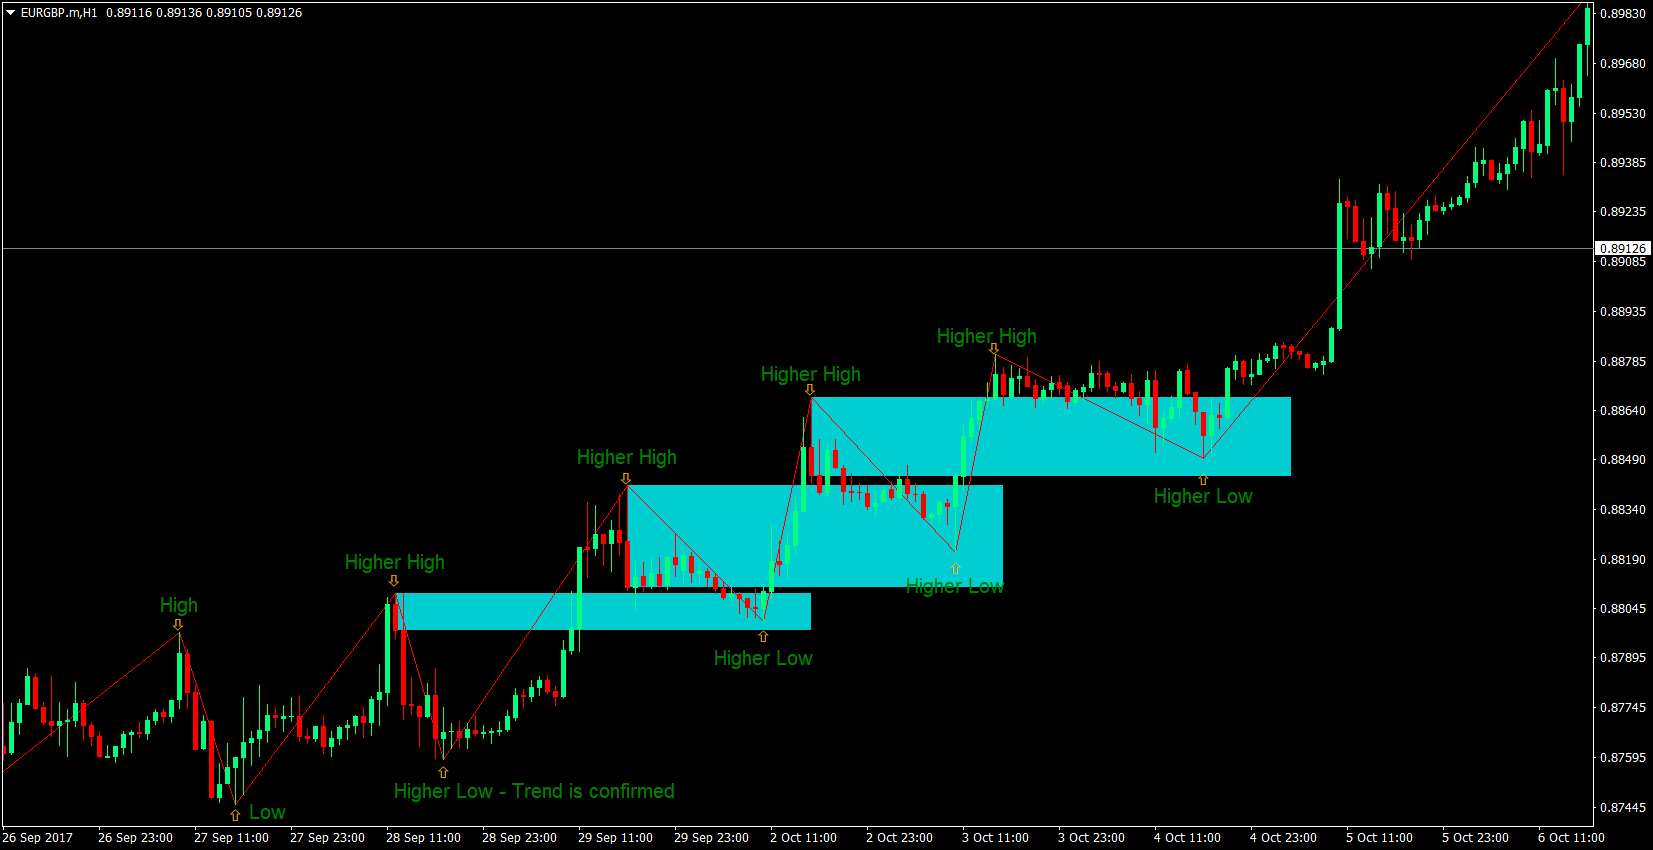
Trade Setup: Entry, Stop Loss & Take Profit

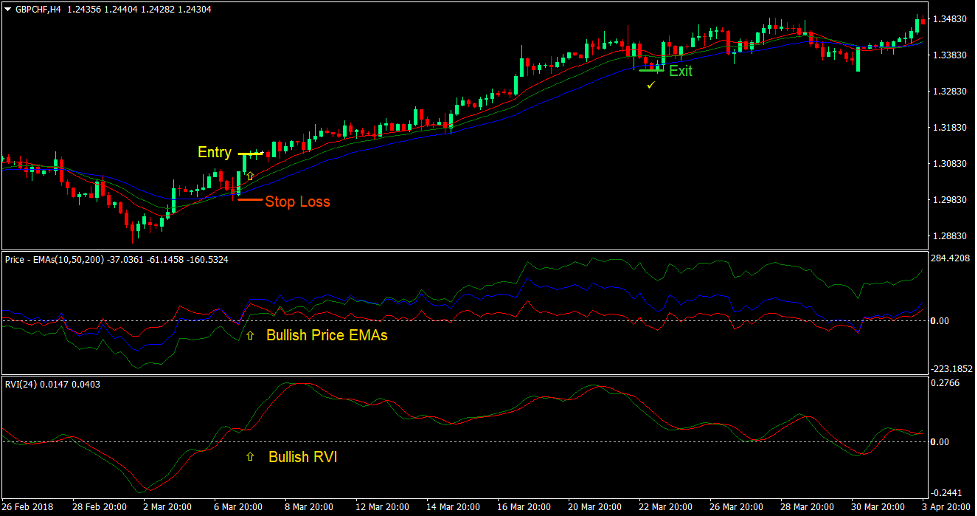
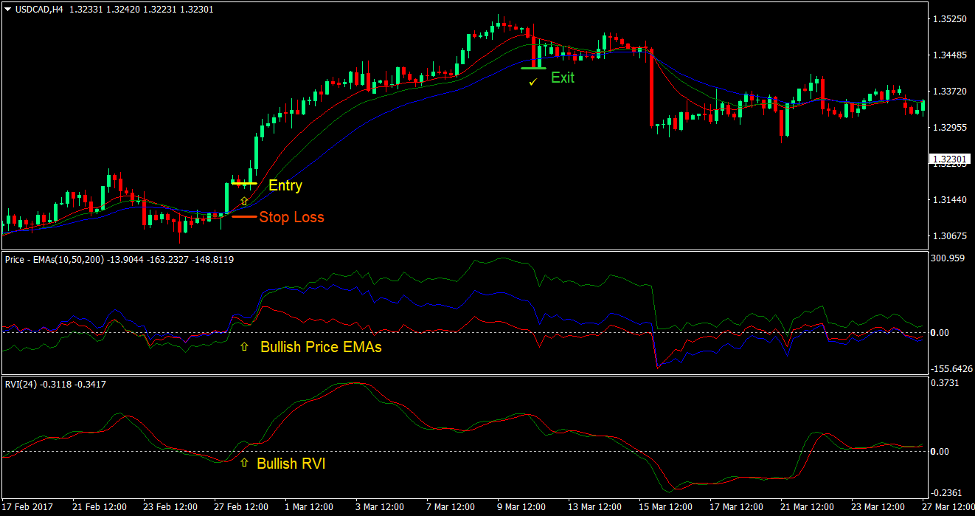
Since the chart analyzed is a bullish market, we will be analyzing a buy setup.

Entry: We will be waiting for price to retrace back to the area of support. Once price reaches the area, we will be looking for it to bounce off the area. As soon as price creates a reversal candlestick pattern that closes above the support area, we enter the trade.

Stop Loss: The stop loss should be a few pips below the support area.

Take Profit: The target take profit should be placed at the peak of the swing high.

Conclusion

This strategy is a simple market flow type of trading strategy, which utilizes the power of a trending price action. Given that both market flow and trending price action is combined into a trading strategy, the trade setups become more of a high probability trade setup. This increases the chances that the take profit would be hit instead of the stop loss.

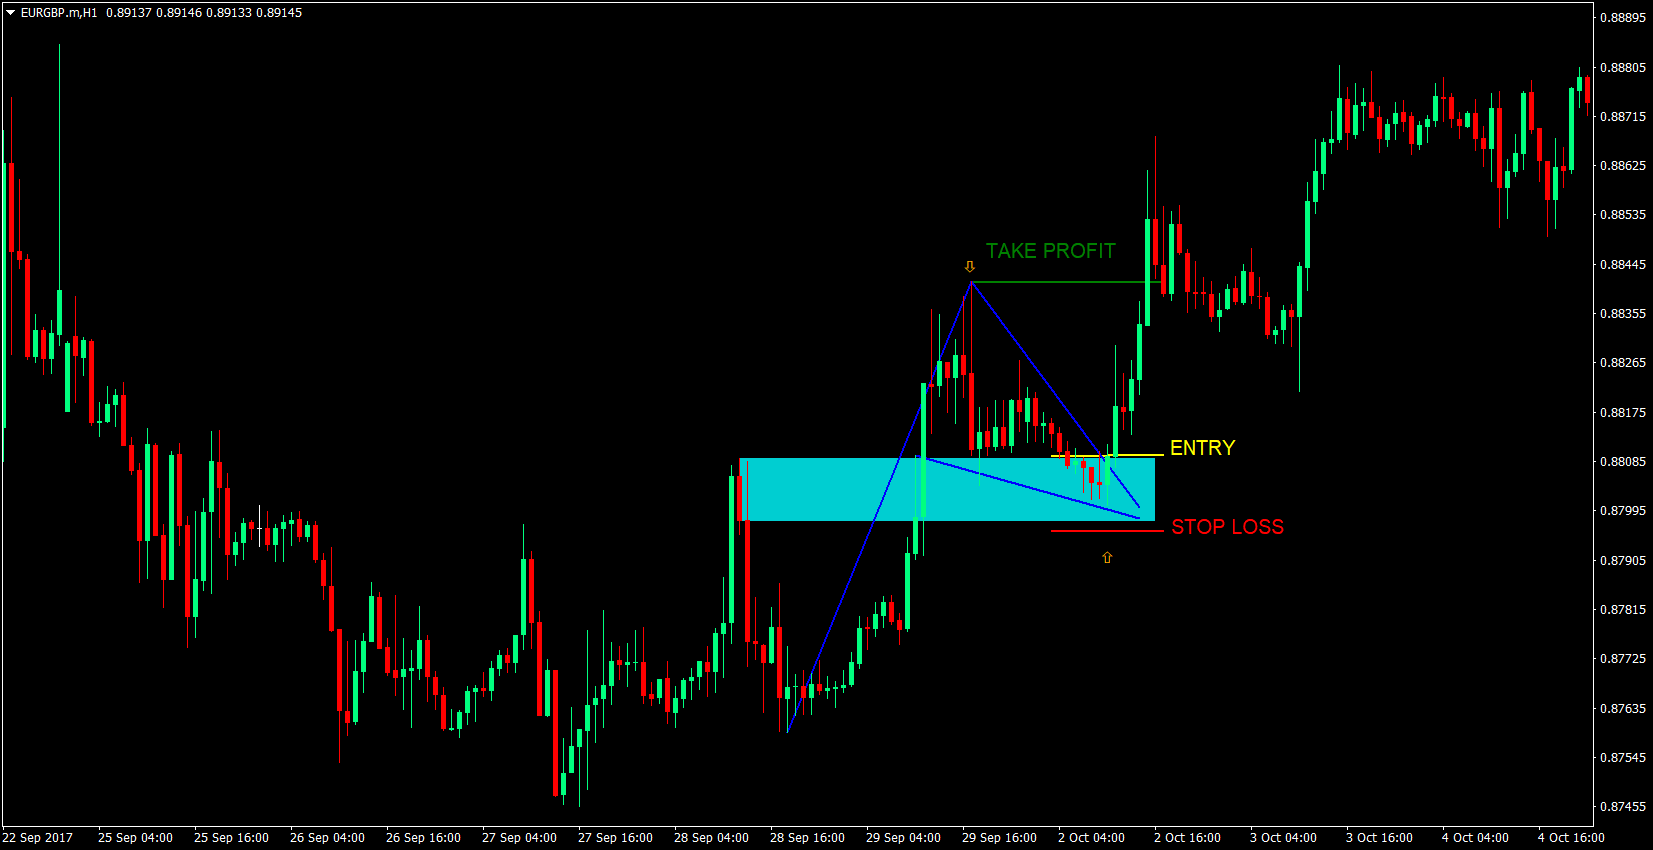
Another trading strategy that could be combined with this is the bull flag strategy. If you would look closely, the retracements could also be considered as a bull flag that broke through a diagonal resistance.

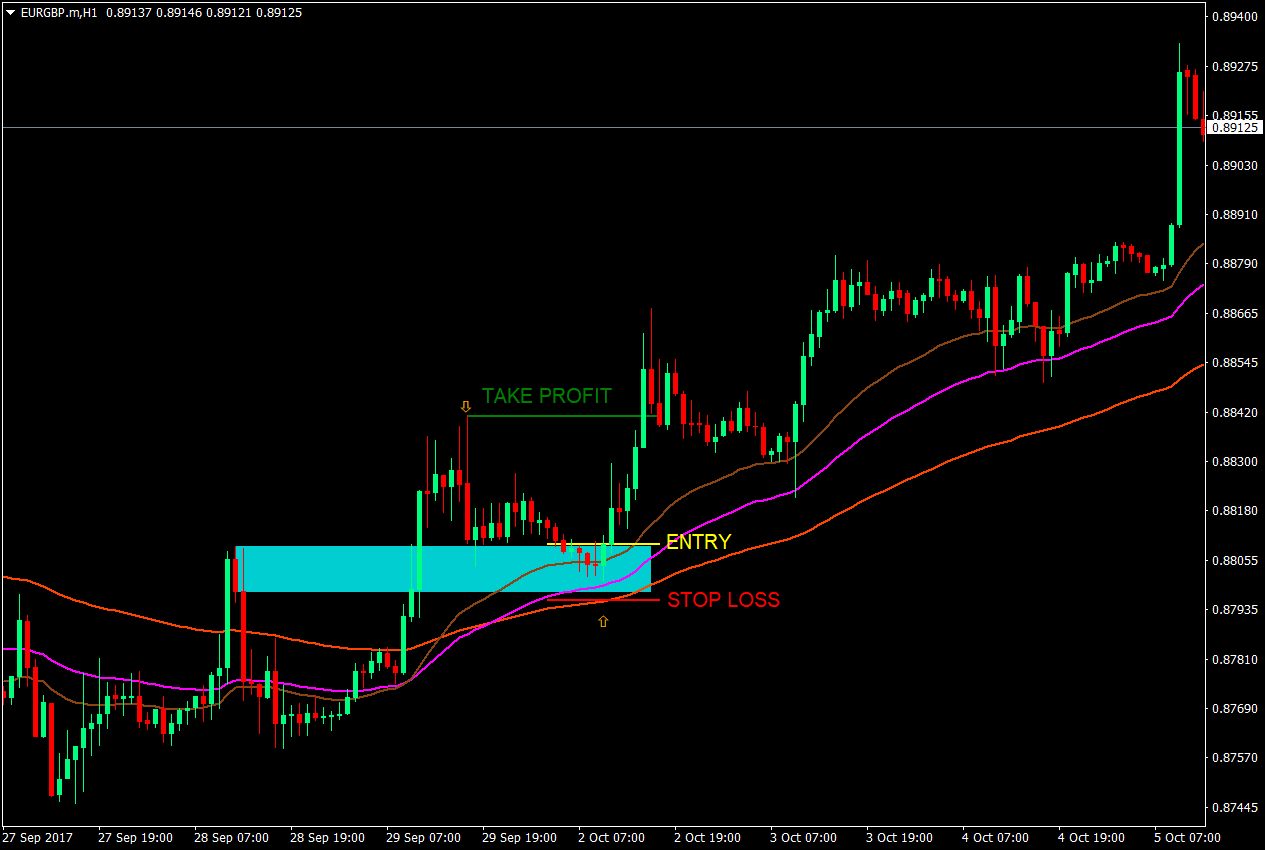
Also, if you would be using a three-band moving average as a compliment to this strategy, you would also find that the three-band moving average is also stacked neatly on top of the other, indicating a trend, and that the start of the thrust also took off from a dynamic support formed by the moving averages.

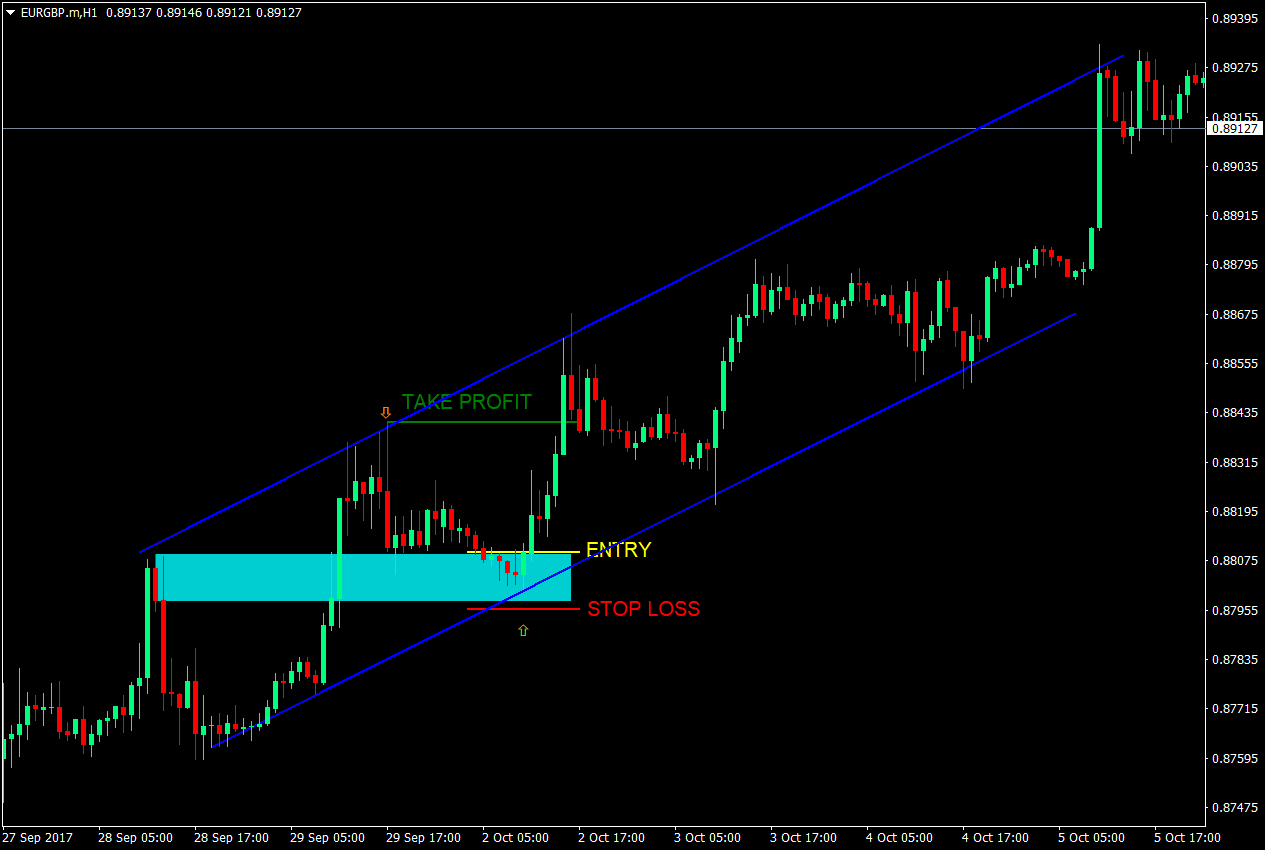
Other traders who trade diagonal channels could also see it on a different light. They could say that the trade was a bounce off the diagonal support.

There are many ways to skin the cat. You could trade this setup using different strategies. All these trading systems in confluence just increases the odds that the setup would be in profit.

The advantage of using the price action or market flow type trading strategy is that it allows traders to easily define the areas where they could look for the reversals or bounces. Unlike bull flags and diagonal supports and resistances, due to the horizontal characteristic of its supports and resistances, it becomes easier for traders to assess if the reversal took place in the correct area.

This strategy is a high probability strategy on its own. Professional traders also use horizontal supports and resistances. But combined with other strategies, it becomes more powerful.


Forex Trading Systems Installation Instructions

Trending Price Action Forex Strategy is a combination of Metatrader 4 (MT4) indicator(s) and template.

The essence of this forex system is to transform the accumulated history data and trading signals.

Trending Price Action Forex Strategy provides an opportunity to detect various peculiarities and patterns in price dynamics which are invisible to the naked eye.

Based on this information, traders can assume further price movement and adjust this system accordingly.

Price Action Simple Forex Binary Options Trading Strategy


Simple Price Action Forex Binary Options Trading Strategy

The simple price action is a trading system that is based on support and resistance with overbought and oversold levels of the V custom 3 indicators. The timeframe used in this system is 5 minutes or higher with an expiry time of 1-2 candles. This method works in any financial market.

Metatrader Indicators:

  • Support and Resistance Barry,
  • Moving Average 21,
  • Vcustom3.

Call Entry:

  1. The custom indicator must have a green bar.
  2. The main chart must form the support (green dot).
  3. Enter at the opening of the next bar.

Put Entry:

  1. The custom indicator must have a green bar.
  2. The main chart must form the resistance(red dot).
  3. Enter at the opening of the next bar.


Binary Options Trading Strategies Installation Instructions

Simple Price Action Forex Binary Options Trading Strategy is a combination of Metatrader 4 (MT4) indicator(s) and template.

The essence of this binary options trading strategy is to transform the accumulated history data and trading signals.

Simple Price Action Forex Binary Options Trading Strategy provides an opportunity to detect various peculiarities and patterns in price dynamics which are invisible to the naked eye.

Based on this information, traders can assume further price movement and adjust this strategy accordingly.

Gator Vigor Forex Trading Strategy


Trading with the trend is probably one of the best ways to trade the markets, whether be it forex, commodities or stocks. It allows traders to identify trade direction easier since price would usually flow in the direction of a strong trend rather than against it. Some trend traders would even go as far as saying that trading with the trend is the only way to trade. Although there are surely other ways to trade, it just shows how much better it is to trade with the trend.

But how do we trade with the trend? First, let us define a trend. Trending market conditions is when price would flow in one direction more often. If the market is in a bullish trending condition, then price would usually close higher than the previous period and swing highs would usually go higher. On the other hand, during a bearish trend, price lows would usually go lower.

Gator Vigor Forex Trading Strategy is a strategy that is based on the concept that price would usually keep flowing in one direction during a trending market condition. Traders would usually price closing higher on a bullish trend, and lower on a bearish trend.

R Gator Indicator

The Gator indicator is an integral part of a set of indicators developed by the legendary trader Bill Williams, which he uses in his trading system.

This indicator basically consists of three Smoothed Moving Averages (SMA). The first moving average, which represents the long-term trend, is called the Jaw. The mid-term indicator is called the Teeth. Lastly, the short-term indicator is called the Lips. This set of moving averages create a band which moves along with price action rather smoother compared to other moving averages. The band expands during a trending market condition and contracts when the trend starts to slow down. Bill Williams refers to this as the opening and closing of the gator’s mouth.

Price – EMAs Indicator

The Price – EMAs indicator is an oscillating indicator which attempts to predict market trend direction, momentum and strength using a set of Exponential Moving Averages (EMA).

This indicator makes use of three EMAs. However, rather than placing the EMAs on the price chart, it plots the difference between the close of price and the EMAs. Whenever the close of price is higher than the mean, the oscillator plot the lines above zero. On the other hand, when the close is lower than the mean, the oscillator plot the lines below zero. In a bullish trend, the lines tend to be plotted higher and higher, while in a bearish trend, the lines are plotted lower and lower. The lines also expand whenever the trend is strengthening and contract when the trend is weakening.

Relative Vigor Index

The Relative Vigor Index (RVI) is an oscillator which is based on the concept that price tends to close higher during a bullish trend and closes lower during a bearish trend. It then shadows the movements of price action based on a mathematical computation intended to be in phase with the cycles of the market.

Inspecting the behavior of the RVI closely, you would notice that it does follow price action quite closely, with some divergences every now and then. This makes the indicator useful for divergence trading. It is also an unbounded oscillator with a midline at zero. Price tends to keep above zero during a bullish trend and below zero during a bearish trend. Having the trigger at zero also makes it useful as a trend reversal indicator.

Trading Strategy

This strategy is a trend reversal strategy based on the crossing over of the moving average lines of the R Gator indicator.

However, instead of taking the trade signals at face value, the strategy makes use of the Price – EMAs indicator as an indicator of trend reversal and strength. Trades are taken only when the three lines of the Price – EMAs indicator have crossed the midline.

This strategy also makes use of the Relative Vigor Index as a confirmation that the market is indeed trending based on the close of the candles. Trades are filtered based on the location of the RVI’s lines in relation to its midline.

Indicators:

  • r_Gator
    • period: 10
    • period_1: 16
    • period_2: 26
  • price-emas
  • Relative Vigor Index
    • Period: 24

Timeframe: 1-hour, 4-hour and daily charts

Currency Pairs: major and minor pairs

Trading Session: Tokyo, London and New York sessions

Buy Trade Setup

Entry

  • The RVI lines should be above zero indicating a bullish trend
  • The Price – EMAs lines should cross above zero indicating a bullish trend reversal
  • The r_Gator indicator’s red line should cross above the green and blue lines indicating a bullish trend reversal
  • Enter a buy order on the confluence of the above market conditions

Stop Loss

  • Set the stop loss at the support level below the entry candle

Exit

  • Close the trade as soon as price closes below the blue line of the r_Gator indicator

Gator Vigor Forex Trading Strategy 1

Gator Vigor Forex Trading Strategy 2

Sell Trade Setup

Entry

  • The RVI lines should be below zero indicating a bearish trend
  • The Price – EMAs lines should cross below zero indicating a bearish trend reversal
  • The r_Gator indicator’s red line should cross below the green and blue lines indicating a bearish trend reversal
  • Enter a sell order on the confluence of the above market conditions

Stop Loss

  • Set the stop loss at the resistance level above the entry candle

Exit

  • Close the trade as soon as price closes above the blue line of the r_Gator indicator

Gator Vigor Forex Trading Strategy 3

Gator Vigor Forex Trading Strategy 4

Conclusion

This strategy takes into consideration major aspects which are important a trend following strategy, trend direction, entry points based on trend reversals, and trend strength. By doing so, the strategy gets to have better chances at getting trades that would result in a trend. In fact, in most cases, the strategy would indicate trade setups that could yield reward-risk ratios of more than 2:1. However, not all cases are like this. There will be instances when the market would reverse too soon. For this reason, it is also very important to manage trades properly, moving stop losses to breakeven at the right time, and trailing stop losses at a good distance. This protects profits which could be lost whenever the market decides to reverse too soon.


Forex Trading Strategies Installation Instructions

Gator Vigor Forex Trading Strategy is a combination of Metatrader 4 (MT4) indicator(s) and template.

The essence of this forex strategy is to transform the accumulated history data and trading signals.

Gator Vigor Forex Trading Strategy provides an opportunity to detect various peculiarities and patterns in price dynamics which are invisible to the naked eye.

Based on this information, traders can assume further price movement and adjust this strategy accordingly.

Wednesday 7 November 2018

Full Throttle Forex Trading system for MT5 and MT4


Full Throttle Forex where you’re going to learn how to apply some new techniques to our old indicators that for the next many years will give you the edge that the players who invented these indicators had 30 and 40 years ago when they created them.
That’s why we call this Full Throttle Forex, because we move in with more confidence and we can lay it on a little thicker than most and make more money than everyone!

Are you ready to get started?
What I’m about to reveal to you in the following pages are some statistical advantages that will allow you to time your entries and even your exits with remarkable accuracy.
This will become the cornerstone for the Full Throttle method.
In other words we don’t make a move until we start the odds in our favor with 85%+…..

Thursday 26 October 2017

best simple forex trading strategies that actually work

HELLO TRADERS,

AM NEW TO THIS WEBSITE AND DECIDE TO POST MY PERSONAL SYSTEM.
IT HAS BEEN MAKING ME STEADY PROFIT BUT SOMETIMES WHEN AM LATE IN THE MARKET I DON'T MAKE ANY THING AND THATS WHY AM HERE  SO THAT I CAN GET HELP URGENTLY.

THE SYSTEM:
TIME FRAME:DAILY
NO INDICATORS
CURRENCY: ALL 

STRATEGY:
IMMEDIATELY AFTER THE OPEN OF A NEW CANDLE STICK FOR A NEW DAY
I PLACE BUY STOP 30PIPS ADDED TO THE  OPEN PRICE
PLACE SELL STOP 30PIPS MINUS FROM THE OPEN PRICE
STOP LOSS 50 PIPS
TAKE PROFIT 10

PLEASE CHECK THE HISTORY ON DAILY CHART SO FAR AND DISCOVER WHAT AM TALKING ABOUT, I FOUND THIS SYSTEM AND I USED IT PERSONALLY AND HAVE BEEN MAKING 10 PIPS AND MORE EACH DAY.

THE WEAKNESS IN THIS SYSTEM:

IF YOU DON'T PLACE TRADE EARLY ON TIME U WILL MISS THE OPPORTUNITY
THIS WHERE I NEED ASSISTANCE FROM THE MEMBERS IN THIS FORUM TO CREATE AND EA FOR ME BASED ON THIS SYSTEM .

PLEASE I REALLY NEED YOUR HELP, PLEASE HELP ME
FOR MORE CONTACT EMAIL:MRAFOLABIPLAZA@YAHOO.COM

I DON'T MIND IF EVERY ONE WILL DEMO TRADE WITH ME ON THIS SYSTEM AND ALSO POST RESULTS.

Thursday 10 September 2015

xforex Swing Pips System for binary and algorithmic trading - форекс


Swing Pips System:


 Swing Pips” program is principally a trend-momentum system this is certainly after for trading forex (foreign exchange market.) The techniques combined with this working xforex system tend to be effective and efficient.(форекс)

I found this Forex System in a Trading Room.
And this can Also be used in Binary trading and algorithmic trading in foreign exchange market.
The device is used various signs to recognize the main trend and explain to you the entry/exit things which are most readily useful. This indicator can also be designed with effective opposition and assistance indicators that we’ll be using to put end loss and goals.

Timeframe H1 or more.


Currency sets: Any.

Metatrader Indicators
1 – Stoch Candles ( considering Stochastic signal )
Blue Candles = Up trend, BUY Signal. Red Candles = Down trend, Market Signal.
2 – Trend Filter2 ( According to Moving Averages )
Blue Bars= Up trend, BUY Signal. Red Bars = Down trend, Sell Signal.This signal is likewise employed for trend reversal alerts produced by Divergence
indicators,
3 - this signal works as a trend signal that presents the path of this trend,
also works as a trend energy sensor that enables you to definitely determine if the trend is
effective sufficient or otherwise not.
Blue Dots = Effective Up Trend = BUY Signal
Red Dots = Effective Down Trend = Market Signal
4 – Support And Resistance Indicators
The initial signal reveals more help that is effective weight AMOUNTS. Blue
dots = support/resistance, Red dots = supports being effective weight amounts.
We’re going to utilize this signal for stops and objectives.
The signal this is certainly 2nd significant help and weight AREAS.
This signal will primarily be properly used for objectives.
Trend Channel signal is in fact an artistic trend identifier ). It
Provides verification this is certainly artistic the others of signs utilized to recognize the main
trend.
It does not offer buy/sell signals nonetheless it provides overbought and places that are oversold –
between purple outlines.
Purple lines = Overbought = feasible Reversal
yellowish line = Oversold = feasible Reversal
Final signal that we’re likely to make use of may be the one which will show us the most effective
entry/exit things…
Wave Arrows
This signal is dependent on Fractals. Plus it provides entry this is certainly aesthetic exit
recommendations by means of Red and Blue arrows.
Red Arrow = Offer Signal = Close BUY
Blue Arrow = Get Signal = Close Market

System’s procedures
BUY Signal
1- Blue Candles
2- Trend Filter = Blue Bars
3- Trend Channel (Polynomial Regrssion) = Up Trend
4- ADX MA = Blue Dots

Market Signal
1- Red Candles
2- Trend Filter = Red Bars
3- Trend Channel = Down Trend
4- ADX MA = Red Dots

Stops & Targets
For stops and targets we’re likely to make use of the support/resistance levels/areas
signs or groups associated with the polynomial regression.
http://www.forexstrategiesresources.com/app/download/9919400721/Swing+Pips+System.rar?t=1422895264